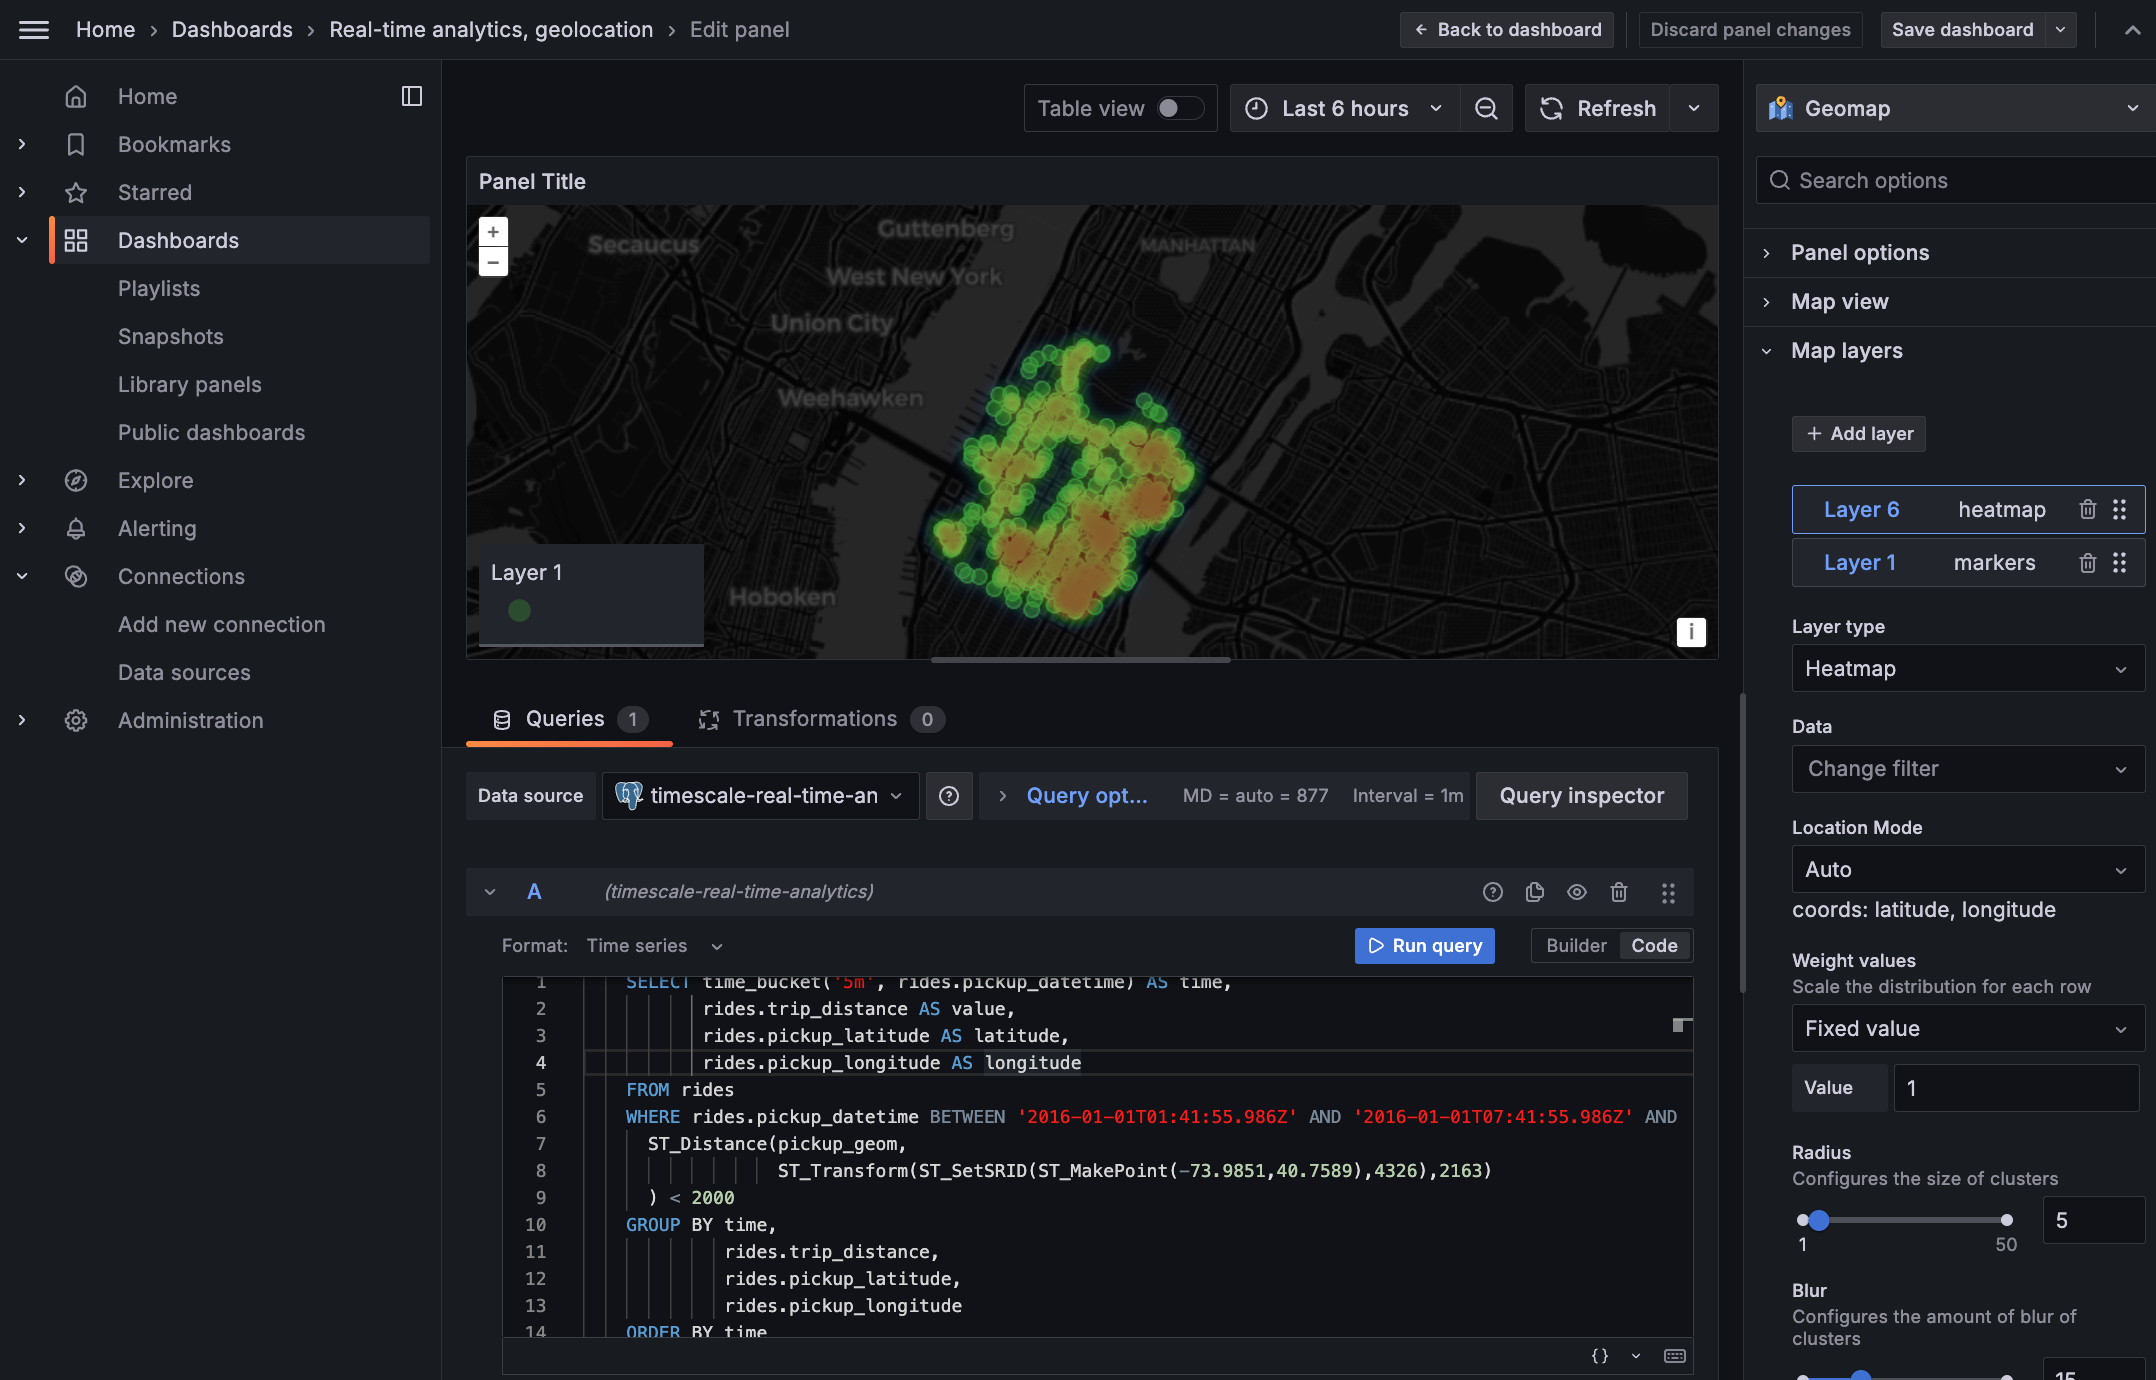
 This page shows you how to integrate Grafana with a and make insights based on visualization
of data optimized for size and speed in the columnstore.
Prerequisites
- Install and run self-managed Grafana, or sign up for Grafana Cloud.
Optimize time-series data in hypertables
Optimize your data for real-time analytics
When converts a chunk to the columnstore, it automatically creates a different schema for your data. creates and uses custom indexes to incorporate thesegmentby and orderby parameters when
you write to and read from the columstore.
To increase the speed of your analytical queries by a factor of 10 and reduce storage costs by up to 90%, convert data
to the columnstore:
Just to hit this one home, by converting cooling data to the columnstore, you have increased the speed of your analytical
queries by a factor of 10, and reduced storage by up to 90%.

